Introduction: When Experts Spend Their Week in Excel
In accounting, insurance, and legal firms, the highest-paid people are often the ones buried in spreadsheets.
Partners, directors, senior associates, spend 10+ hours every week:
- Fixing broken formulas
- Chasing missing information
- Reconciling conflicting numbers
- Preparing reports for clients and regulators
None of this time is billable. None of it improves client service.
But every wasted hour drains margins and pushes deadlines.
Spreadsheets are cheap, familiar, and flexible.
At the start, they are fine. But once a firm grows beyond five or ten people, spreadsheets turn into a liability.
Studies show up to 88 percent of spreadsheets contain errors, and in professional services, those mistakes mean lost revenue, compliance risks, and client frustration.
The good news: you don’t need enterprise software or a big IT project.
Tools like Power BI, Looker Studio, and Zapier can give you structured dashboards in under 30 days.
Affordable. Easy to adopt. Built on the systems you already use.
This guide shows you how. You’ll see:
- Practical BI use cases for accounting, insurance, and legal firms
- A case story of a small firm that saved a workday each week
- A step-by-step roadmap for building a solution in 30 days
- Mock-up dashboards
By the end, you’ll know exactly how to move from spreadsheet chaos to structured clarity, and why your competitors may already be doing it.
Index
Why Spreadsheets Hurt Professional Service Firms
Spreadsheets feel simple, but in reality they cost firms money every week.
The problems are clear:
- Lost time: Senior staff spend days cleaning and merging files.
- Margin pressure: Partners billing €200/hour spend hours reconciling admin.
- Compliance risk: Deadlines are easier to miss when data isn’t structured.
- Client trust: Inconsistent numbers create doubts about reliability and professionalism.
If your firm is small but growing, spreadsheet dependency is not a minor inconvenience.
It is a strategic risk.
BI Use Cases for Legal Firms
Case Status Overview
- Problem: Partners waste meetings just figuring out which cases are active, closed, or on hold.
- BI Fix: Central dashboard shows live case status, deadlines, and milestones.
- Example: A boutique firm can save four hours of partner time per week after replacing update meetings with a real-time dashboard.
Billed vs. Unbilled Hours Tracker
- Problem: Associates record time inconsistently. Unbilled hours slip through and revenue disappears.
- BI Fix: Dashboard compares billed vs unbilled hours, by client and lawyer.
- Example: A 10-lawyer practice can recover 8% of revenue previously lost to unbilled hours.
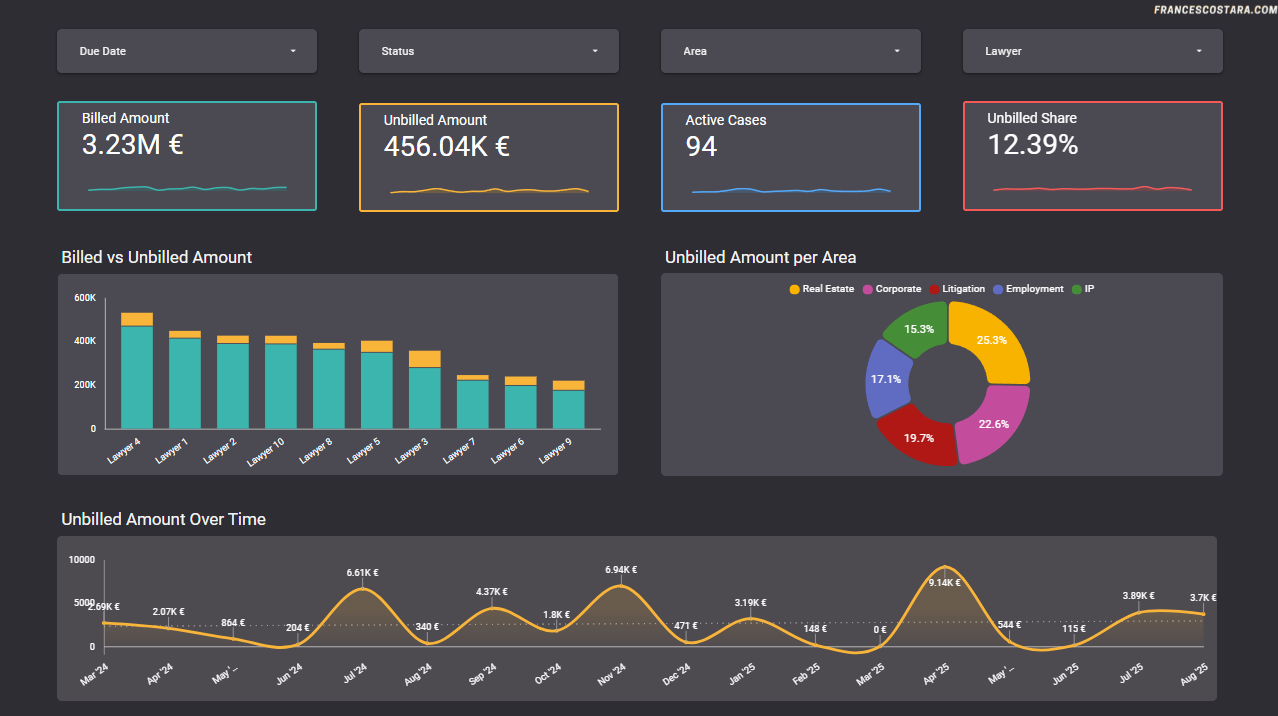
Automated Client Reporting
- Problem: Associates spend hours preparing updates for clients.
- BI Fix: Share secure dashboards with clients. Updates are automatic.
- Example: Transparency improved client retention, while associates reclaimed 5+ hours per week.
BI Use Cases for Accounting Firms
Client Onboarding Tracker
- Problem: New clients send data in inconsistent formats.
Staff chase missing items through endless email chains. - BI Fix: Create a dashboard that tracks onboarding progress.
Google Forms or simple upload portals feed into a Google Sheet, which updates Power BI or Looker Studio. - Example: A 6-person accounting firm can cut onboarding delays by 40% once partners could see (in one screen) exactly which clients were missing which forms.
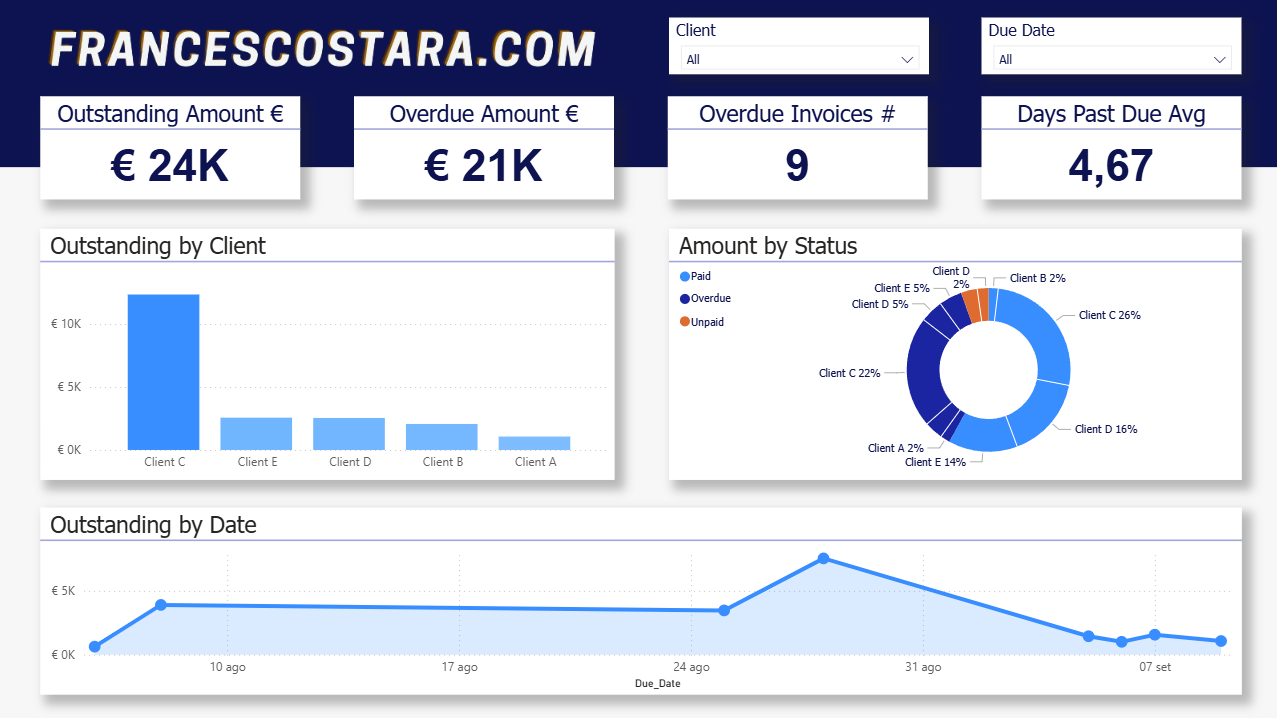
Billing & Collections Tracker
- Problem: Cash flow is unclear when billing is spread across files.
Overdue invoices often go unnoticed. - BI Fix: Use Zapier to sync invoices from Xero/QuickBooks and bank feeds into a central sheet. Visualize in a dashboard with KPIs: outstanding balance, overdue %, days sales outstanding.
- Example: One firm can uncover €40,000 in overdue invoices within weeks of implementation.
Compliance Reporting Automation
- Problem: Senior accountants spend days every month compiling compliance reports.
- BI Fix: Automate extraction and formatting.
Dashboards update daily and can be exported in regulator-ready formats. - Example: A mid-size firm can reduce month-end reporting from three days to three hours.
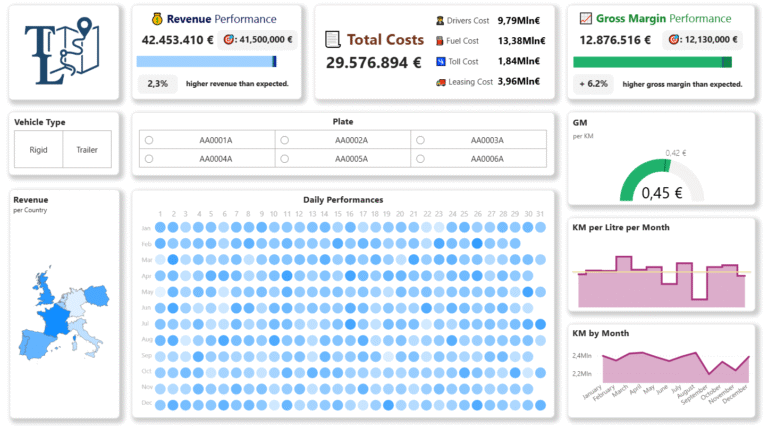
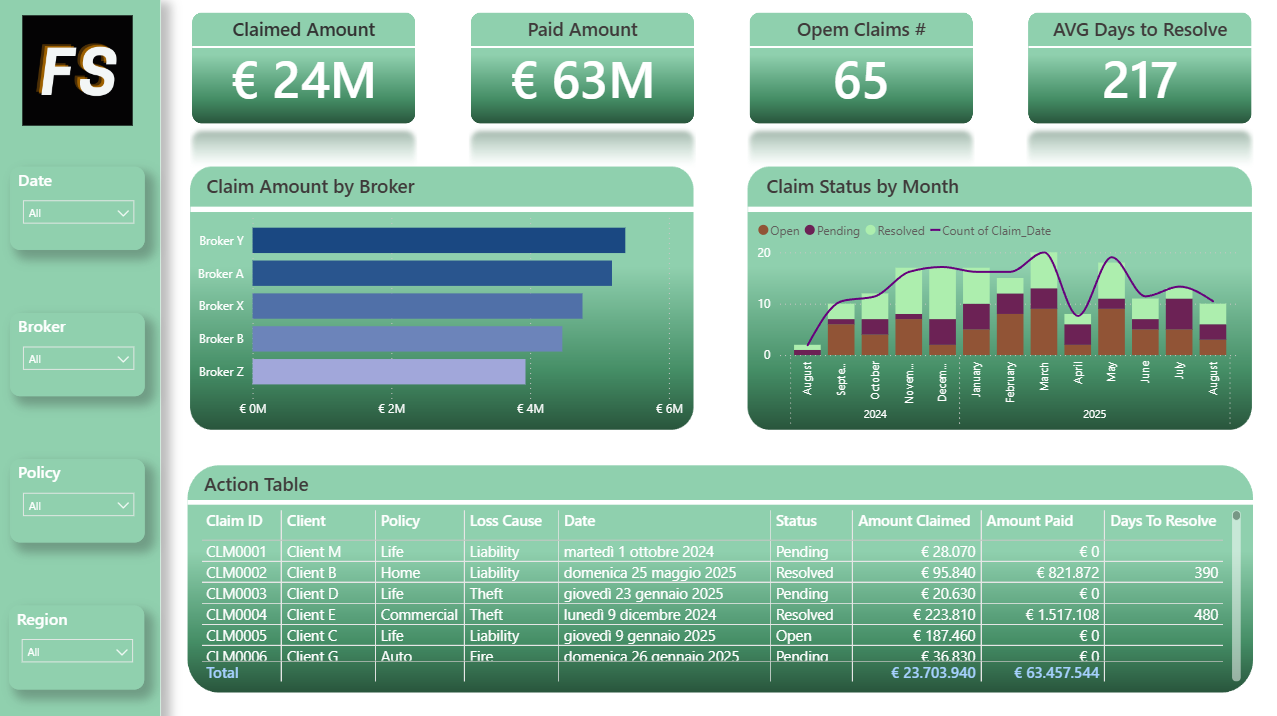
BI Use Cases for Insurance Firms
Claims Pipeline Dashboard
- Problem: Managers can’t see which claims are open, pending, or resolved without checking multiple systems.
- BI Fix: Centralize claims into a single dashboard with stages, resolution times, and bottlenecks.
- Example: A regional broker can improve client satisfaction by 20% after reducing average claims resolution time, because managers could spot delays in real time.
Policy Sales & Renewals Tracker
- Problem: Missed renewals cost recurring revenue.
Spreadsheets updated manually are unreliable. - BI Fix: Automate renewals pipeline reporting.
Dashboards highlight policies expiring in the next 30/60/90 days. - Example: One insurance office can increase renewals by 15% simply by giving account managers a live view of expiring policies.
Broker Performance KPIs
- Problem: Leadership can’t compare brokers fairly without consolidated KPIs.
- BI Fix: Dashboards show broker-level KPIs: new sales, renewals, claims, and satisfaction.
- Example: A firm can use BI scorecards to identify and coach underperforming brokers, raising overall productivity by 12%.
Mini Case Study: A Consultancy Gains Back a Workday
A 12-person advisory firm managed everything in 25 spreadsheets.
Every Friday, two senior associates spent half a day compiling data for a weekly report.
After implementing BI with Google Sheets, Zapier, and Looker Studio in 30 days:
- Reports refreshed nightly, automatically
- Associates stopped chasing missing spreadsheets
- The team gained back an entire workday per week
- They discovered €40,000 in overdue invoices hidden in spreadsheets
This was not an IT-heavy project.
It was quick and affordable, using tools they already had.
Step-by-Step: Build a Dashboard in 30 Days
Take billing as an example.
Week 1: Define Metrics & Sources
- KPIs: invoices issued, outstanding balance, overdue %, days to collect
- Sources: billing spreadsheets, accounting software, bank feed
Week 2: Connect Data
- Use Zapier to push new invoices and payments into a central Google Sheet
- Standardize columns (dates, IDs, amounts) for clean analysis
Week 3: Build Dashboard
- Connect Google Sheet to Looker Studio (free) or Power BI (Pro: €8.40/user/month)
- Visuals: outstanding by client, aging buckets, monthly collections trend
Week 4: Automate & Train
- Schedule daily refresh
- Train partners and staff on reading dashboards (no editing required)
Costs:
- Zapier: €20–50/month
- Looker Studio: free (or Power BI Pro subscription)
- Consultant setup: fixed one-off fee
ROI:
One partner saving 10 hours a month at €200/hour equals €2,000.
The dashboard pays for itself in under a month.
Lessons Learned for Firm Leaders
- Don’t let your most expensive staff spend time in spreadsheets
- Automating reports reduces compliance risk
- Dashboards improve client trust with transparent updates
- Small firms can get results in just 30 days with tools they already know
Escape Spreadsheet Chaos
Professional service firms don’t have to accept spreadsheet chaos as normal.
In a single month, you can move from messy files to structured dashboards that free your staff, protect compliance, and improve client trust.
👉 Book a free Spreadsheet Stress Test Audit Call (15 Minutes) to identify your bottlenecks.
Or learn more about my 30-Day BI Quickstart System at francescostara.com.