Introduction: The Hidden Risks in Your Spreadsheets
Imagine an Allied bomber plane returning from WWII, riddled with bullet holes.
At a first look, the obvious answer might be to armor the areas with most holes.
But statistician Abraham Wald realized the truth: we should look at the missing planes.
The spots without holes on returning planes were actually the most critical, a bullet there meant certain loss. In other words, the survivorship bias of visible data hid the real danger.
Too often small businesses suffer the same blind spot.
We rely on spreadsheets and visible problems (late deliveries, inventory shortages, missed sales targets), but what about the unseen issues?
A recent study found a staggering 94% of business spreadsheets contain critical errors.
Errors or blind spots in data can quietly eat profits and even threaten survival, as Blockbuster and Kodak discovered the hard way.
In this article I will explore historical and business case studies (from WWII aircraft to Netflix, Target, UPS and the Oakland A’s Moneyball) to extract actionable data insights for small teams (1–50 employees). You’ll learn how to recognize hidden problems, predict opportunities, implement simple BI tools, calculate ROI, and avoid common pitfalls.
As a BI consultant with cross-industry experience (pharma, FMCG, insurance, edtech), I’ll share anonymized examples and step-by-step guidance.
By the end, you’ll see why swapping spreadsheet chaos for structured BI systems (Power BI, Looker Studio, Zapier, etc.) isn’t just smart, it’s lifesaving for your business.
Content
The Problem, Ignoring Hidden Data
Bad Assumptions Can Kill Your Business
Survivorship Bias
During WWII, analysts looked at returning bombers and saw where bullet holes clustered.
The instinct was to armor those spots, until Abraham Wald pointed out the fatal point: you only see the planes that survived.
The missing planes told the story.
In business terms, focusing only on visible failures (or successes) can mislead us.
If your small business only tracks the sales that happened and ignores the deals that fell through, you’ll never understand why.
Ignoring the Data Signals
In the 2000s, Blockbuster saw Netflix’s mailing and streaming service but dismissed it, failing to update its model.
By 2010 Blockbuster was bankrupt.
Kodak’s engineers actually invented the digital camera in the 1970s, but management didn’t push it, fearing it would cannibalize their film business.
Kodak filed for bankruptcy in 2012.
Both companies ignored emerging data (Netflix subscriptions, digital trends) in favor of comfortable “spreadsheets” of the past.
The lesson: refusing to act on data means you risk irrelevance or ruin.
Everyday Small-Biz Scenario
In my work with a European SME in retail, they thought they had accurate stock levels in Excel.
But we discovered frequent formula errors and stale data, causing stockouts and lost sales.
Like the armored planes with holes, the obvious numbers hid the real issue, dozens of SKU counts that were never entered properly.
They realized that relying on ad-hoc spreadsheets was hiding the missing planes of their business.
Key Point
The problem is not just “we need more data.”
It’s that spreadsheet-based processes leave blind spots.
Manual entry, siloed files, and one-off reports can hide the real story.
Studies show 94% of business spreadsheets have errors, leading to wrong decisions.
Before jumping into a BI solution, first recognize where your data might be missing or misleading.
Ask: What aren’t we seeing? Whose “planes” haven’t returned to base in our business data?
Solution Framework, Turning Data into Predictive Insight
Use Data Like a Railway Tycoon and a Streaming Giant
Anticipate the Future (William Whitewright)
In 1878, railroad financier William Whitewright Jr. bought land ahead of a Texas railroad’s path, using insider knowledge of expansion routes.
His data-driven foresight made him profit and even the town of Whitewright, TX was named for him.
The moral: use patterns in data to act before competitors do.
Small businesses can mirror this by mining historical sales, web traffic, or even local economic trends to spot emerging opportunities.
Predict Success (Netflix & Target)
Netflix famously analyzed its users’ DVD rental data and viewer habits to decide on House of Cards.
By 2013, Netflix had a huge data set of what viewers watched; it noticed overlap between fans of the British series, director David Fincher and actor Kevin Spacey.
Confident in a hit, Netflix bypassed the pilot stage and invested $100M in the series.
The result: a smash success and a template for data-driven TV.
Target, too, used shopping data to predict behavior.
Its analysts saw that pregnant women buy lots of unscented lotion and certain vitamins early in pregnancy.
They built a “pregnancy prediction” score to identify expectant customers before baby showers. (An anxious father once complained after Target sent coupons for baby items to his teen daughter, revealing the model’s power.)
These examples show how past customer data signals future needs.
Data Tools: Power BI, Looker Studio, Zapier
How can a small team do something similar without Netflix’s budget?
Modern BI and ETL tools are surprisingly affordable. For example:
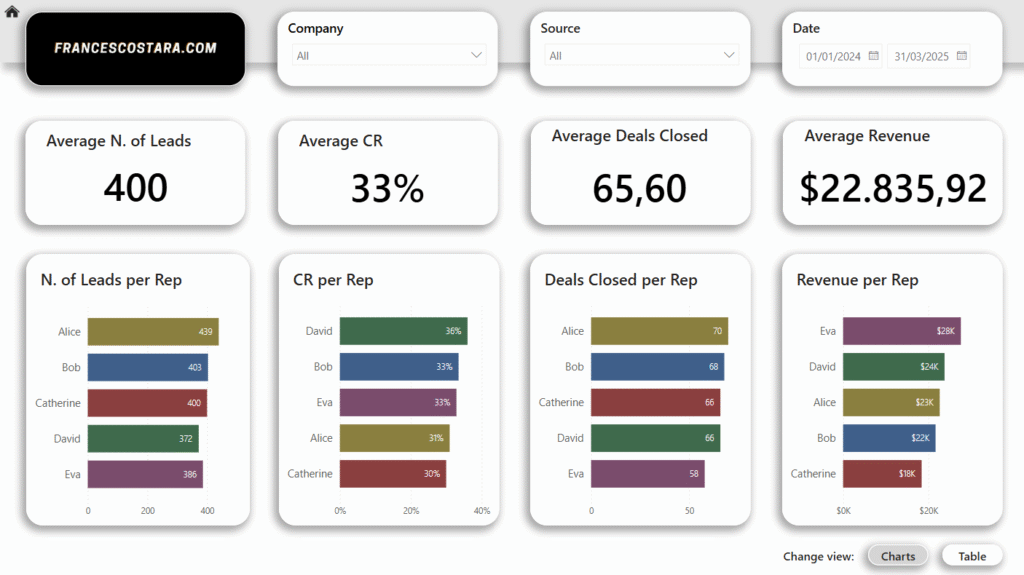
- Power BI (from Microsoft) offers free and low-cost tiers for building interactive dashboards. In my FMCG work, we connected multiple product spreadsheets to Power BI so marketing and sales could see real-time trends on one screen.
- Looker Studio (Google Data Studio) is free and web-based. A local edtech client used it to merge student attendance and quiz score data into a single report, replacing a dozen disconnected sheets.
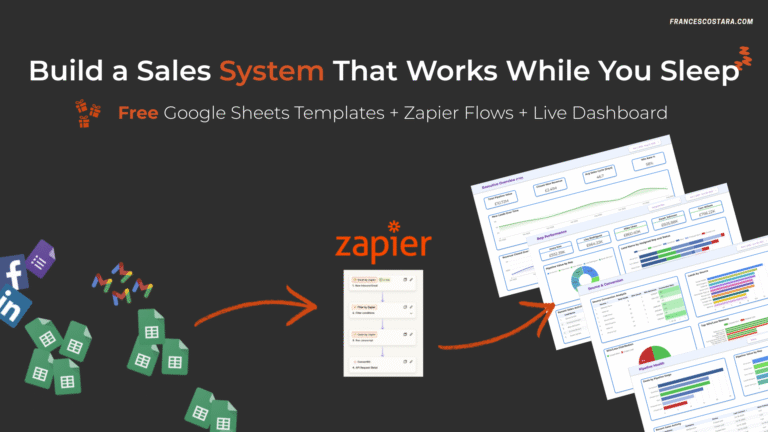
- Zapier and similar ETL tools let you automate data flows. You can, for example, have your CRM send new customer data to Google Sheets or Power BI automatically. This cuts manual entry and ensures your dashboards stay fresh.
Example: From Pharma to P&L
In pharma, I once helped a department tracking lab results in Excel.
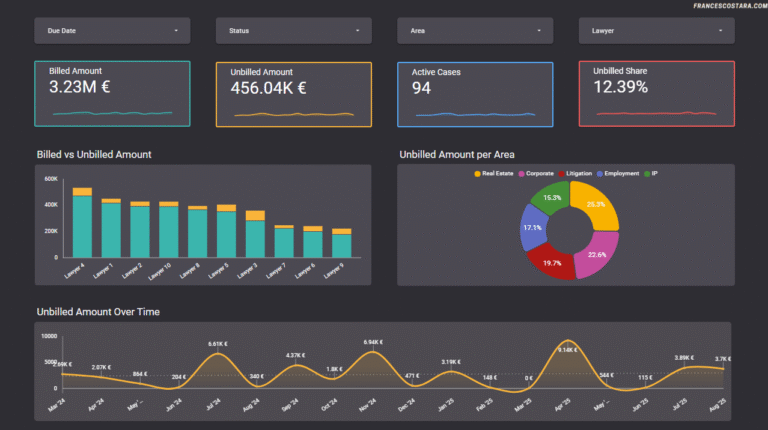
By integrating data via Zapier into Power BI, they built a dashboard to flag anomalies.
The hidden ‘planes’ (inconsistent batch yields), became visible.
In insurance, merging claims and customer demographics revealed fraud patterns that spreadsheets alone missed.
Across industries, the solution is the same: create a simple data pipeline, visualize the right metrics, and let patterns emerge.
Building the Framework
Start by listing key metrics (e.g. monthly sales, top customers, inventory turnover).
Connect your data sources to a BI tool.
Use affordable ETL/automation (Zapier, Integromat, etc.) to feed data into it.
Look for overlooked signals, the factors your past reports didn’t consider.
Just as Whitewright capitalized on planned railroad routes, or Netflix on viewer overlaps, use your data to forecast the next “big thing” in your market.
Implementation for Small Teams – Step-by-Step
How To Actually Make It Work
Small businesses often think “This sounds great, but it’s too complex for our team.”
In reality, with the right approach, even a 5-person office can do it.
Here’s a step-by-step blueprint:
- Choose a Champion – Pick one person (or team) who will lead the BI project. Often it’s someone who already loves Excel or data. With training in Power BI or Looker Studio, this person becomes the hub for insights.
- Start Small (Minimum Viable Analytics) – Don’t try to convert every spreadsheet at once. Select one critical spreadsheet or reporting process (e.g. monthly sales by product). Use an ETL tool or a simple script to pull that data into a BI tool. Create one dashboard that shows the most important metrics at a glance.
- Iterate and Expand – Once the first dashboard proves useful, add more data sources step by step: a CRM export, an inventory list, a website analytics feed, etc. For example, an edtech company might first dashboard student enrollment, then later add course completion rates. Each new data adds clarity (and more “holes” filled).
- Train the Team – Even the best dashboard does no good if nobody uses it. Hold a quick workshop or 1:1 training so team members see how to read the charts. In my projects, I often run a short tutorial to show managers how to explore reports (filter by product, timeframe, etc.). This builds trust , remember that UPS had to convince drivers that the optimized routes were better, not forcing them blindly. Likewise, explain why each chart matters to staff.
- Leverage Low-Code Tools – If coding is not an option, tools like Zapier and Make (formerly Integromat) can connect apps (QuickBooks, Shopify, Google Sheets) to your BI platform without a developer. A hospitality client used a Zap to send booking data from an online form into Power BI every day. No one had to tinker with code, yet the owner immediately saw occupancy rates in real time.
- Review & Refine Metrics (Avoid Moneyball Pitfall) – The Oakland A’s in Moneyball taught us a great lesson: focus on truly predictive metrics. Billy Beane ignored glamorous batting stats and instead picked undervalued players with high on-base percentage. For your business, identify which metrics really drive revenue or efficiency. Don’t be afraid to drop vanity metrics. A small online store found that instead of tracking “email opens,” the key was actually “email-to-purchase conversion,” and they refocused accordingly.
- Emphasize Quick Wins – Show short-term benefits to keep momentum. For example, after rolling out a simple sales dashboard, highlight a quick win (like spotting that $2,000 of sales were on track to be missed last month, which the team fixed). These stories build confidence.
Tools in Action
Suppose you’re a 10-person grocery distributor.
You might use Zapier to copy daily sales from your POS into a Google Sheet.
That sheet feeds Looker Studio to chart daily demand.
Power BI could connect your accounting and order system to forecast cash flow.
In every case, small automation removes manual tedium and frees you to ask “what if” questions.
🤔 Feeling overwhelmed?
Book a 15-min free consultation with me.
I’ll walk you or your team through a custom plan.
ROI and Success Metrics – Proving the Value
How to Measure and Justify the Investment
Quantify the Gains
Concrete numbers sell the idea.
Industry data suggest BI yields big returns: one study found implementing a BI solution can deliver a 127% return on investment over three years.
And companies calling themselves “data-driven” are 23 times more likely to acquire new customers and 19 times more likely to be profitable.
Translate that to your scale: If BI helps you capture just a few extra customers, save hours of manual work, or avoid a costly mistake, the payback is huge.
Key Success Metrics
Think in terms of business outcomes, not just reports built. Possible metrics include:
- Revenue Uplift: Compare sales growth or new customer conversion before/after BI dashboards.
- Cost Savings: Track hours saved on manual reporting. (If your bookkeeper spent 5 hours a week on Excel, and BI cut that to 1 hour, that’s 4 hours × their wage saved.)
- Accuracy & Risk: Count errors caught by BI (e.g. a journal entry error spotted before it became a major problem).
- Time to Decision: BI can cut decision time. (Frontline ops sometimes decide weekly vs monthly). The Scoop report above notes analytics makes decision-making up to 5x faster.
Example – UPS Saves Millions
A dramatic example comes from UPS.
Their ORION route-optimization software effectively banned unnecessary left turns.
This math-based approach saved 100 million delivery miles and $300–$400 million annually. (For UPS this was the payoff after a $250M investment.)
For your business, the savings scale down, but the concept stands: little efficiencies add up.
In a small delivery fleet, even reducing just 10% of fuel use could save thousands per year.
Case Study – Actual ROI
A SaaS startup I worked with moved from Excel to Looker Studio for customer analytics.
Within six months, they identified churn risk patterns and improved retention, reducing churn by 20%.
This translated to an extra $50K revenue that year, far more than their BI tool subscription cost.
Always tie BI metrics to the bottom line when possible.
Affordability & Trials
Mention the tooling here: Many BI platforms offer free trials or low-cost starter plans. (Power BI Pro is only about $10/month per user after trial).
Many CRM/ERP systems have built-in dashboards – try their free tier.
By leveraging trials, you can demonstrate value before a big spend.
Common Pitfalls and How to Avoid Them
Don’t Shoot the Wrong Targets
Even with great data, businesses can stumble. Watch out for these traps:
- Focusing on the Wrong Data (Survivorship Bias Again): Like Wald’s planes, don’t just armor the data you see. A common pitfall is over-indexing on “vanity metrics” (social media likes, RSS followers) that don’t affect profit, while ignoring core issues (customer lifetime value, repeat order rate). Always ask: what’s the silent evidence we’re missing?
- Data Overload & Analysis Paralysis: A killer mistake is trying to use every possible metric. The Oakland A’s example is instructive: they didn’t need every baseball stat, just the ones that truly drove runs (OBP). Similarly, start with a few KPIs. If your BI dashboard shows dozens of charts, no one will use it. Trim it down.
- Poor Data Quality: Feeding garbage into a BI tool just gives garbage outputs. We’ve seen small teams manually joining together spreadsheets from email threads and PDFs, inevitably errors slip in. Before automating, spend time on data cleaning and simple checks (e.g. data types, no missing key fields). It might seem boring, but it prevents big headaches later.
- Resistance to Change: Humans like to think “This is how we’ve always done it.” Remember how UPS drivers distrusted ORION’s routes until managers rode along to explain the math. Expect some pushback. Mitigate it by involving the team early: ask colleagues what reports they really need. When they feel ownership, adoption jumps.
- Ignoring Security/Compliance: In Europe especially, new rules (GDPR, data localization) mean you must handle data carefully. Don’t forget to manage permissions in your BI tools. Make sure customer or patient data isn’t inadvertently exposed. Small companies often overlook these since “we’re small,” but a breach fines can sink a small business.
- Underestimating Maintenance: BI systems need care. Have a plan for periodic updates (e.g. “data will refresh daily”). Plan who will maintain connections. Often a small team relies on one person – make sure they have backup or documentation. I once saw a dashboard go stale because one person left the company; build in redundancy so your insights survive staff changes.
Lessons from History: In summary, the disasters of Blockbuster and Kodak teach one more thing: Dismissing data signals can sink you fast.
On the flip side, small insights can be game-changers.
UPS didn’t revolutionize logistics overnight – they just cut left turns.
The A’s didn’t need a star outfielder – they needed better stats.
As a small business, your advantage is nimbleness.
Use data-driven “right turns” to outsmart big competitors.
Conclusion: Data-Savvy Success, Not Spreadsheet Survival
Throughout history, those who looked where others didn’t got ahead. From reinforcing the unharmed parts of bombers (WWII) to buying railroad land before anyone else knew (Whitewright), the winners understood hidden signals.
Your business can do the same with data.
Key Takeaways:
- Don’t rely solely on visible, spreadsheet-driven reports. Seek the blind spots (survivorship bias) and missing data.
- Harness simple BI tools (Power BI, Looker Studio, Zapier) to automate and visualize critical metrics. Start small and iterate.
- Use historical data to predict future trends (like Netflix & Target did).
- Beware of common pitfalls: watch for poor data quality, analysis paralysis, and resistance to change. Learn from Kodak and Blockbuster’s failures.
- Track your ROI: even modest improvements multiply. Industry research shows BI can deliver 127% ROI and dramatically boost profitability.
Next Steps: Don’t let your business history repeat someone else’s mistakes.
Start by auditing your spreadsheets and data flows today.
If this feels overwhelming, that’s normal – many teams benefit from expert help.
My team helps small businesses implement BI solutions on a budget.
We can review your data “blind spots” and propose a tailored plan (often uncovering opportunities and cost-savings your spreadsheets miss).
Ready to Replace Guesswork with Insight?
Let’s talk!
Book a free 15-minute discovery call to identify the one data insight you need to grow, or request a complimentary BI health check.
You’ll walk away with at least three quick wins to implement in your business.