
In this project, I worked on a comprehensive examination of online transactional data, of an e-commerce. I utilized Python for preliminary exploration, SQL for investigation and querying the data, and Power BI for visualization, this work showcases a blend of data analytics and visual representation, with a focus on UI design.
The main goal here is to understand, clean, and structure the dataset through an exploratory data analysis (EDA), as we’ll transition to SQL for more advanced analysis and Power BI for creating an e-commerce dashboard visualization in the subsequent phases of the project.
This project dives into a UK-based e-commerce retailer’s sales data over a year.
The database is available here: Link.
Contents
Exploratory Data Analysis (Python)
I will use the following Python libraries:
1. Importing and Initial Inspection of the Dataset
The first step is always importing the necessary Python libraries and loading the dataset.
# Importing libraries
import pandas as pd
import numpy as np
import matplotlib.pyplot as plt

# Importing the dataset
raw_data = pd.read_csv(r'C:\Users\Francesco\Desktop\Progetti Portfolio\ECOMMERCE\data.csv', parse_dates=['Date'])

# Viewing the first few rows of the raw dataset and its shape
initial_view_raw = raw_data.head()
shape_raw = raw_data.shape

initial_view_raw, shape_raw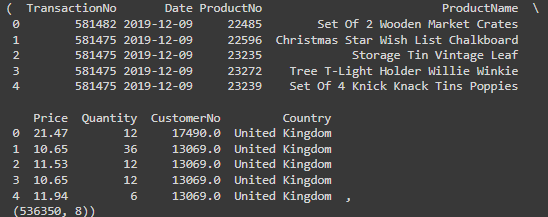
The dataset contains 536,350 rows and 8 columns.
The available columns are: TransactionNo, Date, ProductNo, ProductName, Price, Quantity, CustomerNo, and Country.
2. Handling Missing Data
In this step, I check for missing values to prepare the data for the next steps.
# Checking for missing values
missing_values_raw = raw_data.isnull().sum()

missing_values_raw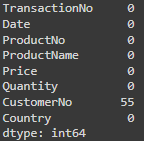
The CustomerNo column has 55 missing values, a very small portion of the dataset.
All other columns are complete without any missing values.
I decided to handle the missing values replacing the missing values with “Unkown”.
# Replacing missing values in 'CustomerNo' with 'Unknown'
raw_data['CustomerNo'].fillna('Unknown', inplace=True)

# Verifying that there are no more missing values
missing_after_replacement = raw_data.isnull().sum()

missing_after_replacement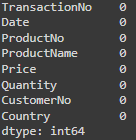
3. Handline negative values: Splitting the Dataset
As it is described in the Content part in the available description of the database:
“Quantity (numeric): the quantity of each product per transaction. Negative values related to cancelled transactions.“
I think would be useful to split the data into two subsets: cancelled and non-cancelled transactions.
# Splitting the dataset into cancelled and non-cancelled transactions
cancelled_data_eda = raw_data[raw_data['Quantity'] < 0].copy()
non_cancelled_data_eda = raw_data[raw_data['Quantity'] >= 0].copy()

# Getting the shape of both datasets
cancelled_data_shape_eda = cancelled_data_eda.shape
non_cancelled_data_shape_eda = non_cancelled_data_eda.shape

cancelled_data_shape_eda, non_cancelled_data_shape_eda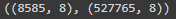
The dataset has been divided into two:
Cancelled Transactions: 8,585 entries
Non-Cancelled Transactions: 527,765 entries
4. Handling Outliers
Now in this next step of the EDA I will look for outliers, using some boxplots to have a clear view of the distribution of the data.
# Visualizing the distribution of Price and Quantity for non-cancelled transactions using boxplots

# Setting up the plotting space
fig, axes = plt.subplots(nrows=1, ncols=2, figsize=(16, 6))

# Boxplot for Price
axes[0].boxplot(non_cancelled_data_eda['Price'], vert=False)
axes[0].set_title('Boxplot for Price')
axes[0].set_xlabel('Price (£)')
axes[0].set_yticks([])

# Boxplot for Quantity
axes[1].boxplot(non_cancelled_data_eda['Quantity'], vert=False)
axes[1].set_title('Boxplot for Quantity')
axes[1].set_xlabel('Quantity')
axes[1].set_yticks([])

plt.tight_layout()
plt.show()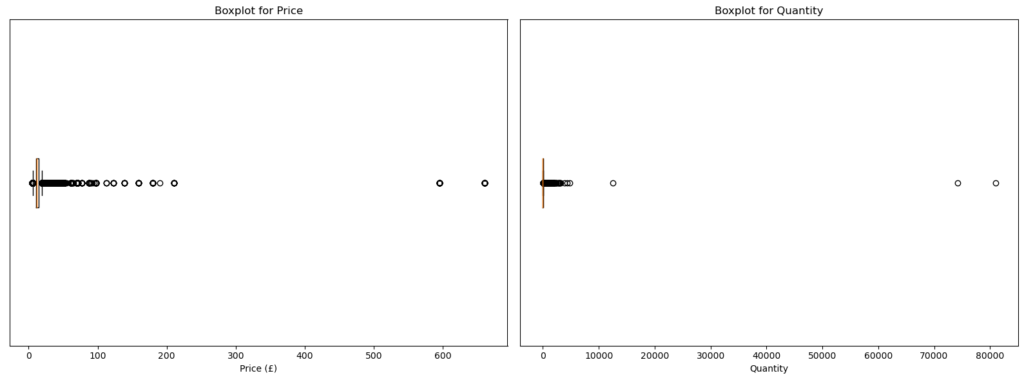
Boxplot for Price:
A majority of the product prices cluster within a relatively low range.
Several data points on the higher end suggest products with significantly higher prices than most, possibly indicating premium items.
Boxplot for Quantity:
Most transactions involve a modest quantity of items.
Data points on the higher end might represent bulk orders or larger purchases.
# Top products based on price in the non-cancelled dataset
top_priced_products_eda = non_cancelled_data_eda[['ProductNo', 'ProductName', 'Price']].drop_duplicates()
top_priced_products_eda = top_priced_products_eda.sort_values(by='Price', ascending=False).head(10)

top_priced_products_eda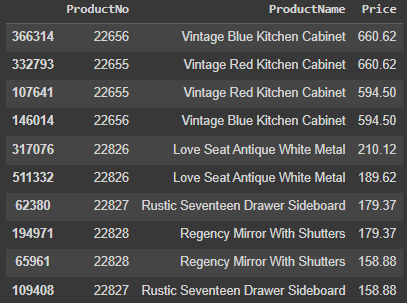
The products with the highest prices appear to be furniture and home decor items. These items naturally tend to be more expensive.
The list suggests that these aren’t outliers, but genuine premium products.
# Transactions with the highest quantities in the non-cancelled dataset
top_quantity_transactions_eda = non_cancelled_data_eda[['TransactionNo', 'ProductNo', 'ProductName', 'Quantity', 'CustomerNo', 'Date']]
top_quantity_transactions_eda = top_quantity_transactions_eda.sort_values(by='Quantity', ascending=False).head(10)

top_quantity_transactions_eda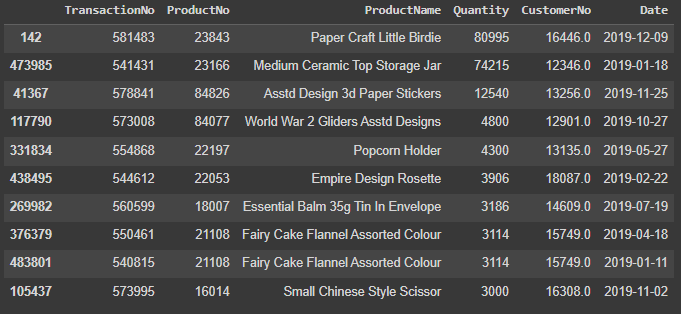
The quantities are high, but they appear genuine given the nature of the products.
There’s no immediate indication that these are data errors.
With the exploratory data analysis complete, the sales data is ready for further analysis.
The next stages involve using SQL for detailed data analysis and Power BI for clear visual representation.
non_cancelled_data_eda.to_csv("non_cancelled_data.csv", index=False)
cancelled_data_eda.to_csv("cancelled_data.csv", index=False)
Data Mining/Querying (SQL)
Now, with SQL, my main goal is to dig deeper into transactional behaviors.
My goal is to inspect sales trends, discover high-performing products, learn about customer segmentation, and uncover trends in cancelled transactions.
Some of the key issues to be addressed include: How have sales trends changed over the months? Which products are frequently purchased? How do cancellations impact overall sales?
1. Creation and Alteration of Tables
Creation
CREATE TABLE sales_data (
TransactionNo VARCHAR(10),
Date DATE,
ProductNo VARCHAR(10),
ProductName TEXT,
Price DECIMAL(10, 2),
Quantity INT,
CustomerNo VARCHAR(10),
Country TEXT);
CREATE TABLE cancelled_sales_data (
TransactionNo VARCHAR(10),
Date DATE,
ProductNo VARCHAR(10),
ProductName TEXT,
Price DECIMAL(10, 2),
Quantity INT,
CustomerNo VARCHAR(10),
Country TEXT);
Alteration: Let’s add some columns
ALTER TABLE sales_data
ADD COLUMN Year INT,
ADD COLUMN Month INT,
ADD COLUMN Day INT,
ADD COLUMN Sales DECIMAL(10,2);
UPDATE sales_data
SET
Year = EXTRACT(YEAR FROM Date),
Month = EXTRACT(MONTH FROM Date),
Day = EXTRACT(DAY FROM Date),
Sales = Price * Quantity;
ALTER TABLE cancelled_sales_data
ADD COLUMN Year INT,
ADD COLUMN Month INT,
ADD COLUMN Day INT,
ADD COLUMN Sales DECIMAL(10,2);
UPDATE cancelled_sales_data
SET
Year = EXTRACT(YEAR FROM Date),
Month = EXTRACT(MONTH FROM Date),
Day = EXTRACT(DAY FROM Date),
Sales = Price * Quantity;
2. Query for Non-Cancelled Transactions
Monthly sales Analysis
Description: This query calculates the total sales for each month.
Question: How much did the store earn in sales each month?
Query:
SELECT Year, Month, SUM(Sales) AS TotalMonthlySales FROM sales_data
GROUP BY Year, Month
ORDER BY Year, Month;
| a. Total sales for each month | |||
| year | month | totalmonthlysales | |
| 1 | 2018 | 12 | 4415415.52 |
| 2 | 2019 | 1 | 4559856.37 |
| 3 | 2019 | 2 | 3335017.18 |
| 4 | 2019 | 3 | 4398401.60 |
| 5 | 2019 | 4 | 3589497.88 |
| 6 | 2019 | 5 | 4578965.08 |
| 7 | 2019 | 6 | 4494730.81 |
| 8 | 2019 | 7 | 4593867.06 |
| 9 | 2019 | 8 | 4758356.02 |
| 10 | 2019 | 9 | 6628303.06 |
| 11 | 2019 | 10 | 7237417.36 |
| 12 | 2019 | 11 | 7861197.12 |
| 13 | 2019 | 12 | 2514949.28 |
Comments:
The highest sales were in November 2019 with a total of £7,861,197.12.
December 2019 witnessed a significant drop in sales to £2,514,949.28, caused by the fact that in our dataset we have only data until 09/12/2019.
Number of transactions per month
Description: This query calculates the number of transactions that occurred each month.
Question: How many transactions took place each month?
Query:
SELECT Year, Month, COUNT(DISTINCT TransactionNo) AS TotalTransactions FROM sales_data
GROUP BY Year, Month
ORDER BY Year, Month;
| b. Number of transactions per month | |||
| year | month | totaltransactions | |
| 1 | 2018 | 12 | 1552 |
| 2 | 2019 | 1 | 1081 |
| 3 | 2019 | 2 | 1096 |
| 4 | 2019 | 3 | 1442 |
| 5 | 2019 | 4 | 1235 |
| 6 | 2019 | 5 | 1670 |
| 7 | 2019 | 6 | 1528 |
| 8 | 2019 | 7 | 1452 |
| 9 | 2019 | 8 | 1341 |
| 10 | 2019 | 9 | 1818 |
| 11 | 2019 | 10 | 2005 |
| 12 | 2019 | 11 | 2753 |
| 13 | 2019 | 12 | 817 |
Comments:
The highest number of transactions occurred in November 2019 with a total of 2753 transactions.
December 2019 had the lowest transactions, which is consistent with the drop in sales, and explained by the presence of data only until 09/12/2019.
Most sold products
Description: This query identifies the top 10 products with the highest quantities sold.
Question: Which products were the most popular among our customers?
Query:
SELECT ProductNo, ProductName, SUM(Quantity) AS TotalQuantitySold FROM sales_data
GROUP BY ProductNo, ProductName
ORDER BY TotalQuantitySold DESC
LIMIT 10;
| c. Top 10 most sold products | |||
| productno | productname | totalquantitysold | |
| 1 | 23843 | Paper Craft Little Birdie | 80995 |
| 2 | 23166 | Medium Ceramic Top Storage Jar | 78033 |
| 3 | 22197 | Popcorn Holder | 56921 |
| 4 | 84077 | World War 2 Gliders Asstd Designs | 55047 |
| 5 | 85099B | Jumbo Bag Red Retrospot | 48478 |
| 6 | 85123A | Cream Hanging Heart T-Light Holder | 37956 |
| 7 | 21212 | Pack Of 72 Retrospot Cake Cases | 36515 |
| 8 | 84879 | Assorted Colour Bird Ornament | 36493 |
| 9 | 23084 | Rabbit Night Light | 30788 |
| 10 | 22492 | Mini Paint Set Vintage | 26633 |
Comments:
“Paper Craft Little Birdie” was the most sold product with a quantity of 80,995.
This is followed by “Medium Ceramic Top Storage Jar” with a quantity of 78,033.
Products generating the most revenue
Description: This query identifies the products that have generated the highest revenue.
Question: Which products have brought in the most revenue?
Query:
SELECT ProductNo, ProductName, SUM(Sales) AS TotalProductRevenue FROM sales_data
GROUP BY ProductNo, ProductName
ORDER BY TotalProductRevenue DESC
LIMIT 10;
| d. Products generating the most revenue | |||
| productno | productname | totalproductrevenue | |
| 1 | 23843 | Paper Craft Little Birdie | 1002718.10 |
| 2 | 23166 | Medium Ceramic Top Storage Jar | 881990.18 |
| 3 | 22197 | Popcorn Holder | 587433.94 |
| 4 | 84077 | World War 2 Gliders Asstd Designs | 569735.39 |
| 5 | 85123A | Cream Hanging Heart T-Light Holder | 484592.69 |
| 6 | 84879 | Assorted Colour Bird Ornament | 421318.74 |
| 7 | 21212 | Pack Of 72 Retrospot Cake Cases | 391485.03 |
| 8 | 23084 | Rabbit Night Light | 329029.89 |
| 9 | 22423 | Regency Cakestand 3 Tier | 307483.85 |
| 10 | 85099B | Jumbo Bag Red Retrospot | 297205.04 |
Comments:
“Paper Craft Little Birdie” generated the highest revenue of £1,002,718.10.
This emphasizes its popularity and potential as a best-selling item.
Top Customers by Revenue
Description: This query lists the top 10 customers who have contributed the most in terms of sales revenue.
Question: Who are our top 10 customers by sales amount?
Query:
SELECT CustomerNo, SUM(Sales) AS TotalSpent FROM sales_data
GROUP BY CustomerNo
ORDER BY TotalSpent DESC
LIMIT 10;
| e. Customers generating the highest revenue | ||
| customerno | totalspent | |
| 1 | 14646.0 | 2112282.03 |
| 2 | 16446.0 | 1002741.57 |
| 3 | 14911.0 | 914633.52 |
| 4 | 12415.0 | 900545.54 |
| 5 | 18102.0 | 897137.36 |
| 6 | 17450.0 | 891438.53 |
| 7 | 12346.0 | 840113.80 |
| 8 | 14156.0 | 694965.02 |
| 9 | 13694.0 | 646116.78 |
| 10 | 17511.0 | 639006.19 |
Comments:
The customer with the ID 14646 contributed the most with a total spending of £2,112,282.03.
This indicates potential high-value customers who might benefit from loyalty programs.
Country-wise distribution of customers
Description: This query shows the distribution of customers based on their countries.
Question: How are our customers distributed across different countries?
Query:
SELECT Country, COUNT(DISTINCT CustomerNo) AS NumberOfCustomers FROM sales_data
GROUP BY Country
ORDER BY NumberOfCustomers DESC;
| f. Country-wise distribution of customers | ||
| country | numberofcustomers | |
| 1 | United Kingdom | 4306 |
| 2 | Germany | 91 |
| 3 | France | 87 |
| 4 | Spain | 23 |
| 5 | Belgium | 22 |
| 6 | Switzerland | 21 |
| 7 | Portugal | 18 |
| 8 | EIRE | 13 |
| 9 | Italy | 12 |
| 10 | Finland | 12 |
| 11 | Australia | 9 |
| 12 | Denmark | 9 |
| 13 | Netherlands | 9 |
| 14 | Japan | 8 |
| 15 | Norway | 8 |
| 16 | Sweden | 7 |
| 17 | Unspecified | 7 |
| 18 | Channel Islands | 7 |
| 19 | Austria | 6 |
| 20 | Cyprus | 6 |
| 21 | Poland | 5 |
| 22 | Israel | 4 |
| 23 | Hong Kong | 4 |
| 24 | USA | 4 |
| 25 | Canada | 4 |
| 26 | Greece | 2 |
| 27 | United Arab Emirates | 2 |
| 28 | Malta | 2 |
| 29 | Bahrain | 2 |
| 30 | European Community | 1 |
| 31 | Iceland | 1 |
| 32 | Lebanon | 1 |
| 33 | Lithuania | 1 |
| 34 | RSA | 1 |
| 35 | Saudi Arabia | 1 |
| 36 | Singapore | 1 |
| 37 | Brazil | 1 |
| 38 | Czech Republic | 1 |
Comments:
Majority of customers are from the United Kingdom, with a total count of 4306.
Germany and France follow with 91 and 87 customers respectively. This shows the primary market is in the UK.
Sales distribution by country
Description: This query calculates the total sales amount from each country.
Question: Which countries contribute the most to the sales of the ecommerce?
Query:
SELECT Country, SUM(Sales) AS CountryTotalSales FROM sales_data
GROUP BY Country
ORDER BY CountryTotalSales DESC;
| g. Sales distribution by country | ||
| country | countrytotalsales | |
| 1 | United Kingdom | 52524658.47 |
| 2 | Netherlands | 2151553.59 |
| 3 | EIRE | 1713410.95 |
| 4 | Germany | 1371543.27 |
| 5 | France | 1330652.89 |
| 6 | Australia | 995607.91 |
| 7 | Sweden | 401879.89 |
| 8 | Switzerland | 361969.25 |
| 9 | Japan | 293155.44 |
| 10 | Spain | 281012.27 |
| 11 | Belgium | 272131.88 |
| 12 | Norway | 188612.52 |
| 13 | Portugal | 176110.40 |
| 14 | Finland | 120972.15 |
| 15 | Denmark | 101083.99 |
| 16 | Channel Islands | 95932.24 |
| 17 | Italy | 78536.24 |
| 18 | Austria | 69147.26 |
| 19 | Singapore | 63480.95 |
| 20 | Cyprus | 62346.75 |
| 21 | Israel | 54943.36 |
| 22 | Iceland | 38321.90 |
| 23 | USA | 32868.65 |
| 24 | Unspecified | 32699.05 |
| 25 | Canada | 30490.91 |
| 26 | Hong Kong | 27835.50 |
| 27 | Poland | 19793.11 |
| 28 | Malta | 12717.23 |
| 29 | United Arab Emirates | 11966.26 |
| 30 | Greece | 9666.53 |
| 31 | Lithuania | 8188.08 |
| 32 | Czech Republic | 7674.44 |
| 33 | European Community | 6210.23 |
| 34 | Lebanon | 5692.32 |
| 35 | Brazil | 4652.27 |
| 36 | RSA | 4259.83 |
| 37 | Bahrain | 3226.86 |
| 38 | Saudi Arabia | 969.50 |
Comments:
The United Kingdom dominates in sales with a massive £52,524,658.47.
The Netherlands comes second but with a significantly lower total of £2,151,553.59.
Day with Maximum Sales
Description: This query identifies the single day with the highest total sales.
Question: On which day did the ecommerce achieve the highest sales?
Query:
SELECT Date, SUM(Sales) AS TotalSales FROM sales_data
GROUP BY Date
ORDER BY TotalSales DESC
LIMIT 1;
| h. Day with Maximum Sales | ||
| date | totalsales | |
| 1 | 12/9/2019 | 1106069.97 |
Comments:
The highest sales in a single day were on December 9, 2019, with total sales of £1,106,069.97.
As explained before, this is the last day available in the dataset, further investigations about the transaction of this day could be executed.
Peak Sales Month
Description: This query identifies the month with the highest sales.
Question: In which month did the ecommerce achieve peak sales?
Query:
SELECT Month, SUM(Sales) AS TotalSales FROM sales_data
GROUP BY Month
ORDER BY TotalSales DESC
LIMIT 3;
| i. Peak Sales Month | ||
| month | totalsales | |
| 1 | 11 | 7861197.12 |
| 2 | 10 | 7237417.36 |
| 3 | 12 | 6930364.80 |
Comments:
November 2019 was the peak month with sales amounting to £7,861,197.12.
Transactions with High Quantity
Description: This query lists transactions where the quantity of products is significantly above average.
Question: Which transactions had unusually high quantities of products?
Query:
WITH AvgQuantity AS (SELECT AVG(Quantity) AS AvgQty FROM sales_data)
SELECT TransactionNo, ProductNo, Quantity
FROM sales_data, AvgQuantity
WHERE Quantity > 5 * AvgQty
ORDER BY Quantity DESC
LIMIT 20;
| j. Transactions with High Quantity | |||
| transactionno | productno | quantity | |
| 1 | 581483 | 23843 | 80995 |
| 2 | 541431 | 23166 | 74215 |
| 3 | 578841 | 84826 | 12540 |
| 4 | 573008 | 84077 | 4800 |
| 5 | 554868 | 22197 | 4300 |
| 6 | 544612 | 22053 | 3906 |
| 7 | 560599 | 18007 | 3186 |
| 8 | 550461 | 21108 | 3114 |
| 9 | 540815 | 21108 | 3114 |
| 10 | 573995 | 16014 | 3000 |
| 11 | 536830 | 84077 | 2880 |
| 12 | 562439 | 84879 | 2880 |
| 13 | 554272 | 21977 | 2700 |
| 14 | 543057 | 84077 | 2592 |
| 15 | 573003 | 23084 | 2400 |
| 16 | 544152 | 18007 | 2400 |
| 17 | 539101 | 22693 | 2400 |
| 18 | 543669 | 22693 | 2400 |
| 19 | 547037 | 21967 | 2160 |
| 20 | 574294 | 21915 | 2100 |
Comments:
Transaction 581483 with product 23843 had an exceptionally high quantity of 80,995. We have already examinate in the EDA the possible reason.
Product Price Distribution
Description: This query categorizes products into different price ranges.
Question: How many products fall into each price range?
Query:
SELECT
CASE
WHEN Price BETWEEN 0 AND 10 THEN ‘Low’
WHEN Price BETWEEN 11 AND 50 THEN ‘Medium’
ELSE ‘High’
END AS PriceRange,
COUNT(DISTINCT ProductNo) AS NumberOfProducts
FROM sales_data
GROUP BY PriceRange
ORDER BY NumberOfProducts DESC;
| k. Product Price Distribution | ||
| pricerange | numberofproducts | |
| 1 | Medium | 3510 |
| 2 | Low | 2688 |
| 3 | High | 1052 |
Comments:
Most products fall within the medium price range with a total of 3510 products.
This indicates the store has a diverse product pricing strategy.
Return Customer Analysis
Description: This query identifies customers who have made multiple transactions, suggesting they return to make purchases.
Question: Who are our returning customers based on the frequency of their transactions?
Query:
SELECT CustomerNo, COUNT(DISTINCT TransactionNo) AS TotalTransactions
FROM sales_data
GROUP BY CustomerNo
HAVING COUNT(DISTINCT TransactionNo) > 5
ORDER BY COUNT(DISTINCT TransactionNo) DESC
LIMIT 10;
| l. Return Customer Analysis | ||
| customerno | totaltransactions | |
| 1 | 12748.0 | 207 |
| 2 | 14911.0 | 198 |
| 3 | 17841.0 | 125 |
| 4 | 13089.0 | 98 |
| 5 | 15311.0 | 91 |
| 6 | 14606.0 | 90 |
| 7 | 12971.0 | 86 |
| 8 | 14646.0 | 73 |
| 9 | 13408.0 | 62 |
| 10 | 16029.0 | 62 |
Comments:
Customer 12748 has the highest number of transactions with a total of 207, suggesting he is a loyal customer.
3. Query for Cancelled Transactions
Cancelled Transactions Count
Description: This query counts the number of transactions that were cancelled.
Question: How many transactions were cancelled?
Query:
SELECT COUNT(DISTINCT TransactionNo) AS CancelledTransactionsCount
FROM cancelled_sales_data;
| a. Cancelled Transactions Count | |
| cancelledtransactionscount | |
| 1 | 3414 |
Comments:
There was a total of 3414 cancelled transactions, which suggests potential areas of improvement in the sales process or product quality.
Products with Most Cancellations
Description: This query identifies the products that are most frequently cancelled.
Question: Which products are cancelled the most by customers?
Query:
SELECT productno, COUNT(DISTINCT TransactionNo) AS CancelledCount
FROM cancelled_sales_data
GROUP BY Productno
ORDER BY CancelledCount DESC
LIMIT 10;
| b. Products with Most Cancellations | ||
| productno | cancelledcount | |
| 1 | 22423 | 180 |
| 2 | 22960 | 87 |
| 3 | 22720 | 73 |
| 4 | 21232 | 57 |
| 5 | 22699 | 54 |
| 6 | 22197 | 50 |
| 7 | 22666 | 47 |
| 8 | 85099B | 43 |
| 9 | 21843 | 42 |
| 10 | 22697 | 42 |
Comments:
Product 22423 was cancelled the most, with a total of 180 cancellations. This raises a flag and demands a deeper dive to understand the reason for these cancellations.
Customers with most cancellations
Description: This query identifies customers who have cancelled the most transactions.
Question: Which customers have cancelled the most transactions?
Query:
SELECT CustomerNo, COUNT(DISTINCT TransactionNo) AS CancelledTransactions
FROM cancelled_sales_data
GROUP BY CustomerNo
ORDER BY CancelledTransactions DESC
LIMIT 5;
| c. Customers with most cancellations | ||
| customerno | cancelledtransactions | |
| 1 | 17841 | 45 |
| 2 | 14911 | 43 |
| 3 | 14606 | 35 |
| 4 | Unknown | 35 |
| 5 | 15311 | 27 |
Comments:
Customer 17841 had the highest number of cancellations at 45. This might indicate dissatisfaction or other issues that should be addressed.
– Findings from SQL Exploration
Monthly sales showed a fluctuating pattern, with months like November having more sales.
Products such as ‘Paper Craft Little Birdie’ and ‘Medium Ceramic Top Storage Jar’ emerged as bestsellers, both in terms of quantity and revenue.
The UK dominated the customer base, with a significant number of sales.
I identified recurring customers, with some of them making more than 200 transactions, emphasizing the importance of customer loyalty.
On the downside, there was a considerable number of cancelled transactions, which offered insights into potentially lost revenues and areas of improvement.
– Answers to Initial Questions
We’ve gained insights into sales trends over the months, identifying peak sales periods.
We’ve recognized top-performing products and those that get frequently cancelled.
We’ve understood the distribution of the customer base and identified loyal customers based on their transaction frequency.
E-Commerce Dashboard (PowerBI)
For the visualization of the ecommerce’s data I decided to use the most famous and widely
used software in the field: Microsoft Power BI.
The goals is to transform analytical findings into informative visuals, with the aim of a better data
interpretation and better decision making, focusing on an appealing User Interface (UI).
What to expect?
Sales Trajectory: I showed the sales trends over time, offering a panoramic view of
business performance.
Top-Performing Products: Visualization tools highlighted the products driving a good
number of sales.
Customer Segmentation: Visual tools allowed for an in-depth comparison of regular
versus occasional shoppers.
Impact of Cancellations: A targeted analysis of cancellations showed their financial
repercussions.
Disclaimer:
For a better comprehension of the data I decided to filter until 30/11/2019.
So I can analyze all the year in its entirely (01/12/2018-30/11/2019).
This could cause some difference with the SQL Query of the previous document.
Let’s dive inside the e-commerce dashboard now.
Page 1: Overview
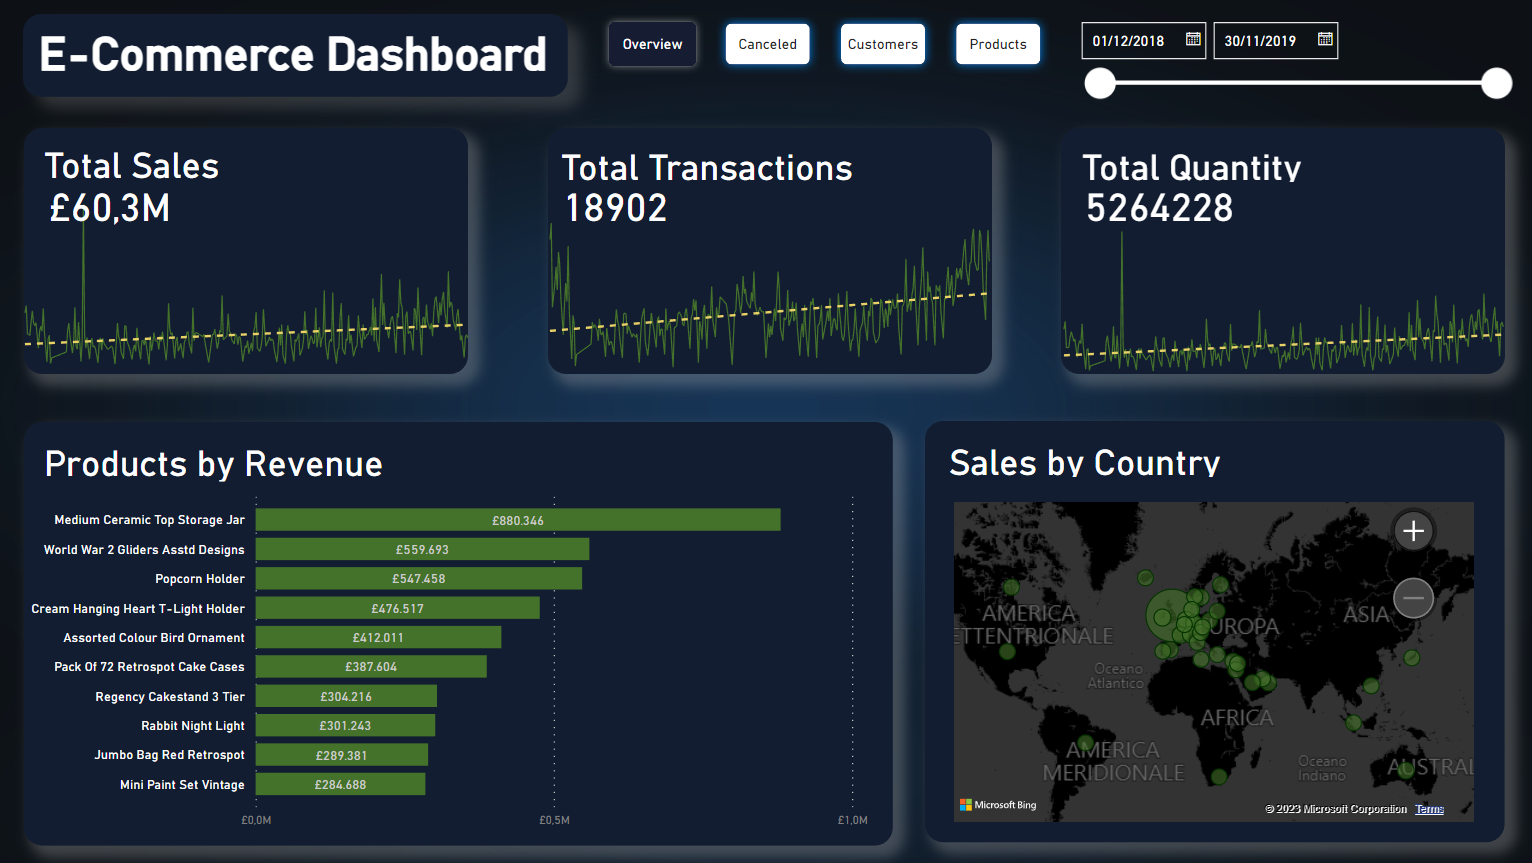
Sales, Transactions, and Quantity Cards: A comprehensive illustration to show the cumulative metrics across these categories. The line graphs has the goal of showing the the day-by-day trends, days of peak performance and the year growth. The value indicated is the total for every category. The line graphs show the trend of the respective categories.
Products by Revenue: A list of the top 10 revenue-generating products, “Medium Ceramic Top Storage Jar” is leading the ranks with £880.346 of revenues.
Sales by Country: A map viz that, using bubble visuals (with each bubble’s dimension indicative of a country’s contribution to total sales) shows the sales by country, here the influence of UK is clear.
Page 2: Canceled Transactions
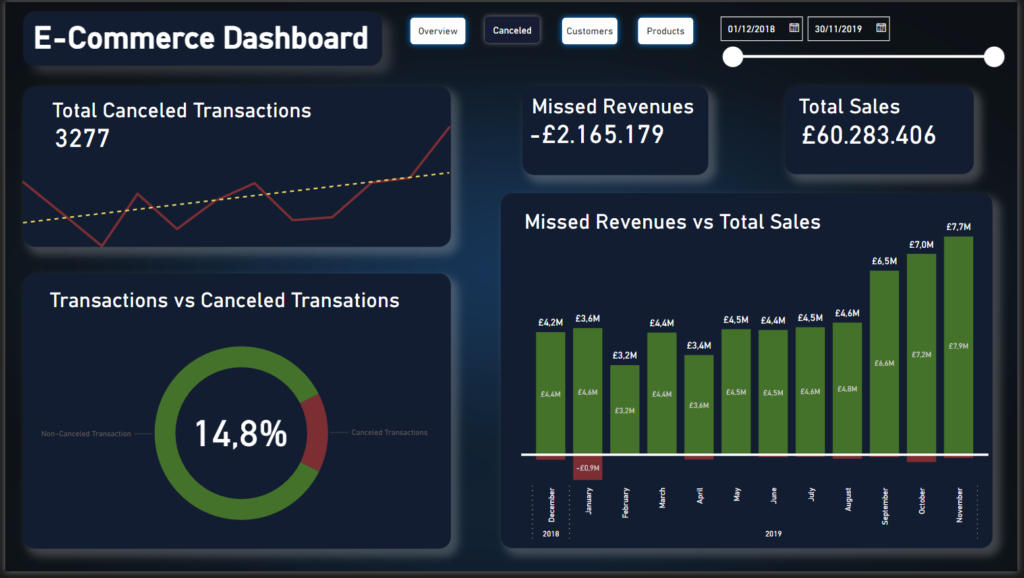
Transaction Trends: Line graph highlighting the monthly trends of canceled transactions, offering insights into potential operational challenges.
Transactions vs Canceled Transactions: Percentage of Transactions Canceled, 14,8% of every transaction is canceled.
Revenue Impact Analysis: Contrasting missed revenues with total sales provides a perspective on the financial implications of cancellations.
Page 3: Customer Insights
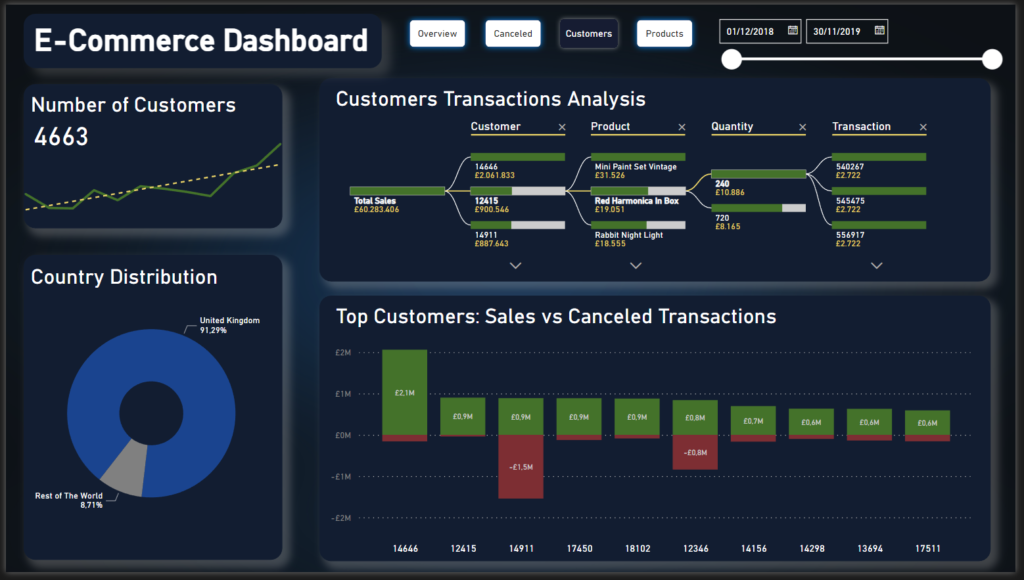
Customer Count Evolution: A timeline showcasing the growth of the unique customer count over the year.
Transaction History: An interactive visualization tool that enables a deep dive into the history of customer transactions, informing about buying behaviors.
Geographical Distribution: Viz that shows the percentage of the customers’ nation, with a clearly dominant presence of UK customers.
Top Customers’ Analysis: A comparison of the top revenue-generating customers with their associated canceled transactions, offering insights into customer reliability. We can observe that customer 14911 created a huge amount of missed revenues, more than 50% of the total.
Page 4: Product Insights
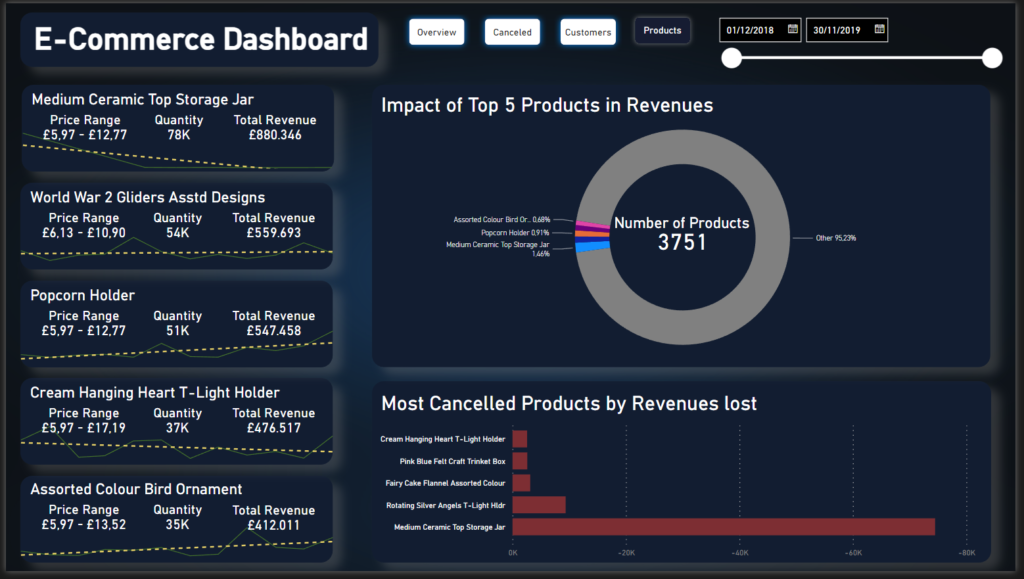
Top 5 Product Analysis: A deep focus into the top 5 revenue-generating products, examining metrics like price range, total quantity sold, and revenue. The associated line graphs chart the sales trend of each product (monthly-based). The price range is high and it depends on the quantity of the specific order/transaction, with discounts on big orders.
Product Impact on Revenues: A visual representation of the total product count, emphasizing the significant revenue contribution of the top 5 products, analyzed in detail before.
Cancellation Impact: Spotlight on the top 5 products with the most cancellations, again here “Medium Ceramic Top Storage Jar” is leading the ranks.
Conclusion
Important points to acknowledge after the analysis are:
– UK Dominance, But Potential Awaits: The UK is the primary market for the e-commerce platform right now. This dominance is promising, but it also suggests potential growth opportunities in other regions. Tapping into these areas could help the platform expand its reach and audience.
– Concerns with Canceled Orders: The e-commerce platform has a significant number of canceled orders. It’s crucial to identify the reasons behind these cancellations. Addressing issues, whether they are delivery-related or tied to product satisfaction, could lead to increased sales and more satisfied customers.
– Gaining Insights into Customer Preferences: The data reveals much about customer preferences and behaviors. Leveraging this information can aid the e-commerce platform in offering tailored deals, establishing loyalty programs, or refining its service. Working with these insights can enhance the overall shopping experience for the users.
– Product Performance Varies: Some products on the platform sell exceptionally well, while others stay behind. The e-commerce platform might consider further promoting the popular ones, or perhaps revisiting and enhancing the ones with slower sales.
In essence, through tools like Python, SQL, and Power BI, a comprehensive picture of the e-commerce operations has emerged.
These insights can start to build the way for refining strategies and ensuring the platform’s continued success in the always evolving online shopping realm.
Have a reporting problem like this one?
I build automated BI systems that replace manual spreadsheets. Happy to take a look at yours.
Text me on WhatsApp See more work on the projects page.