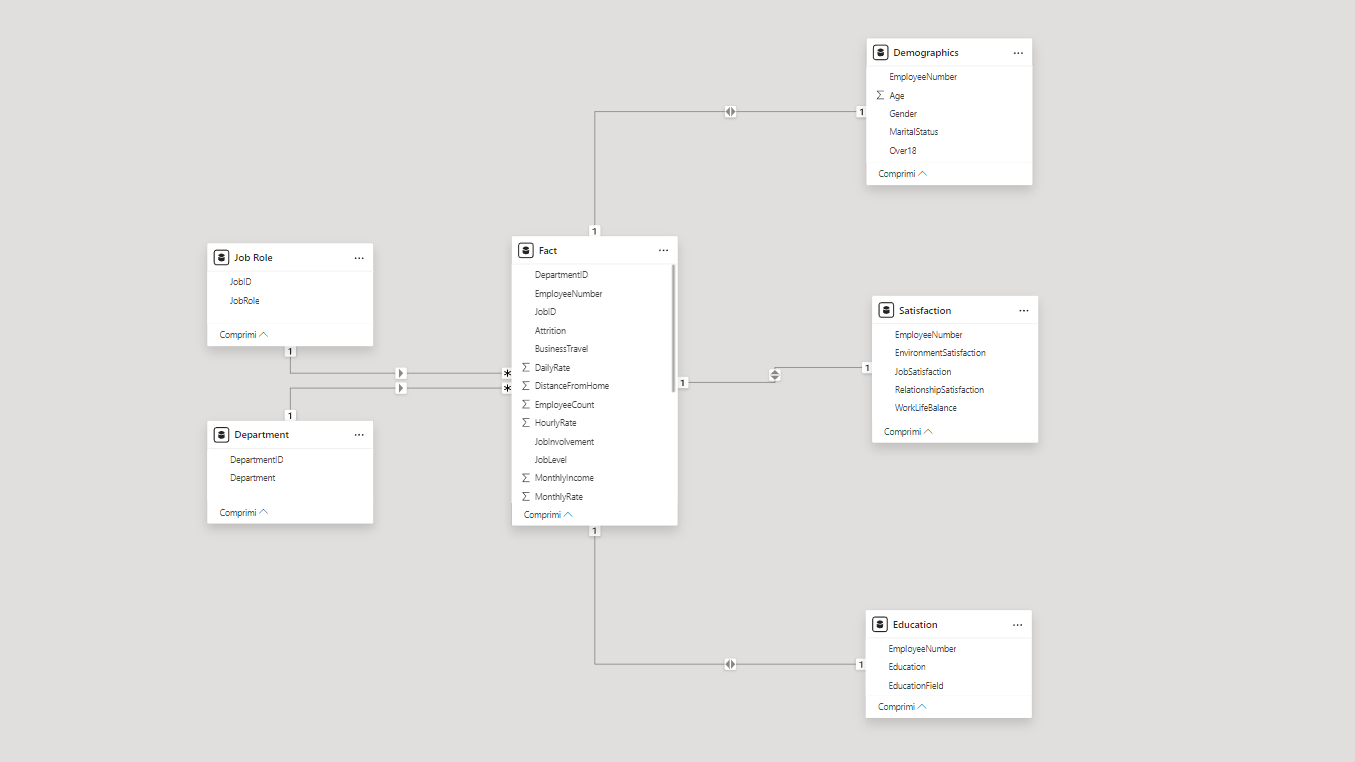
How to Create a Power BI Data Model: Step-by-Step Guide with IBM HR Dataset
This is the first part of a 3 parts project, you can find the full project here. Building a robust data model is…

This is the first part of a 3 parts project, you can find the full project here. Building a robust data model is…

Data modeling is the process of creating a visual representation of an organization’s data and the relationships between different pieces of that data.…

In today’s data-driven world, organizations rely on analytics tools like Power BI to derive actionable insights from vast datasets. However, the accessibility of…

This project focuses on the analysis of gas stations across all provinces in Spain, using a dataset extracted from the official Spanish government…

Exploratory Data Analysis (EDA) is the first and most important step in the data analysis workflow. It allows analysts and scientists to understand…
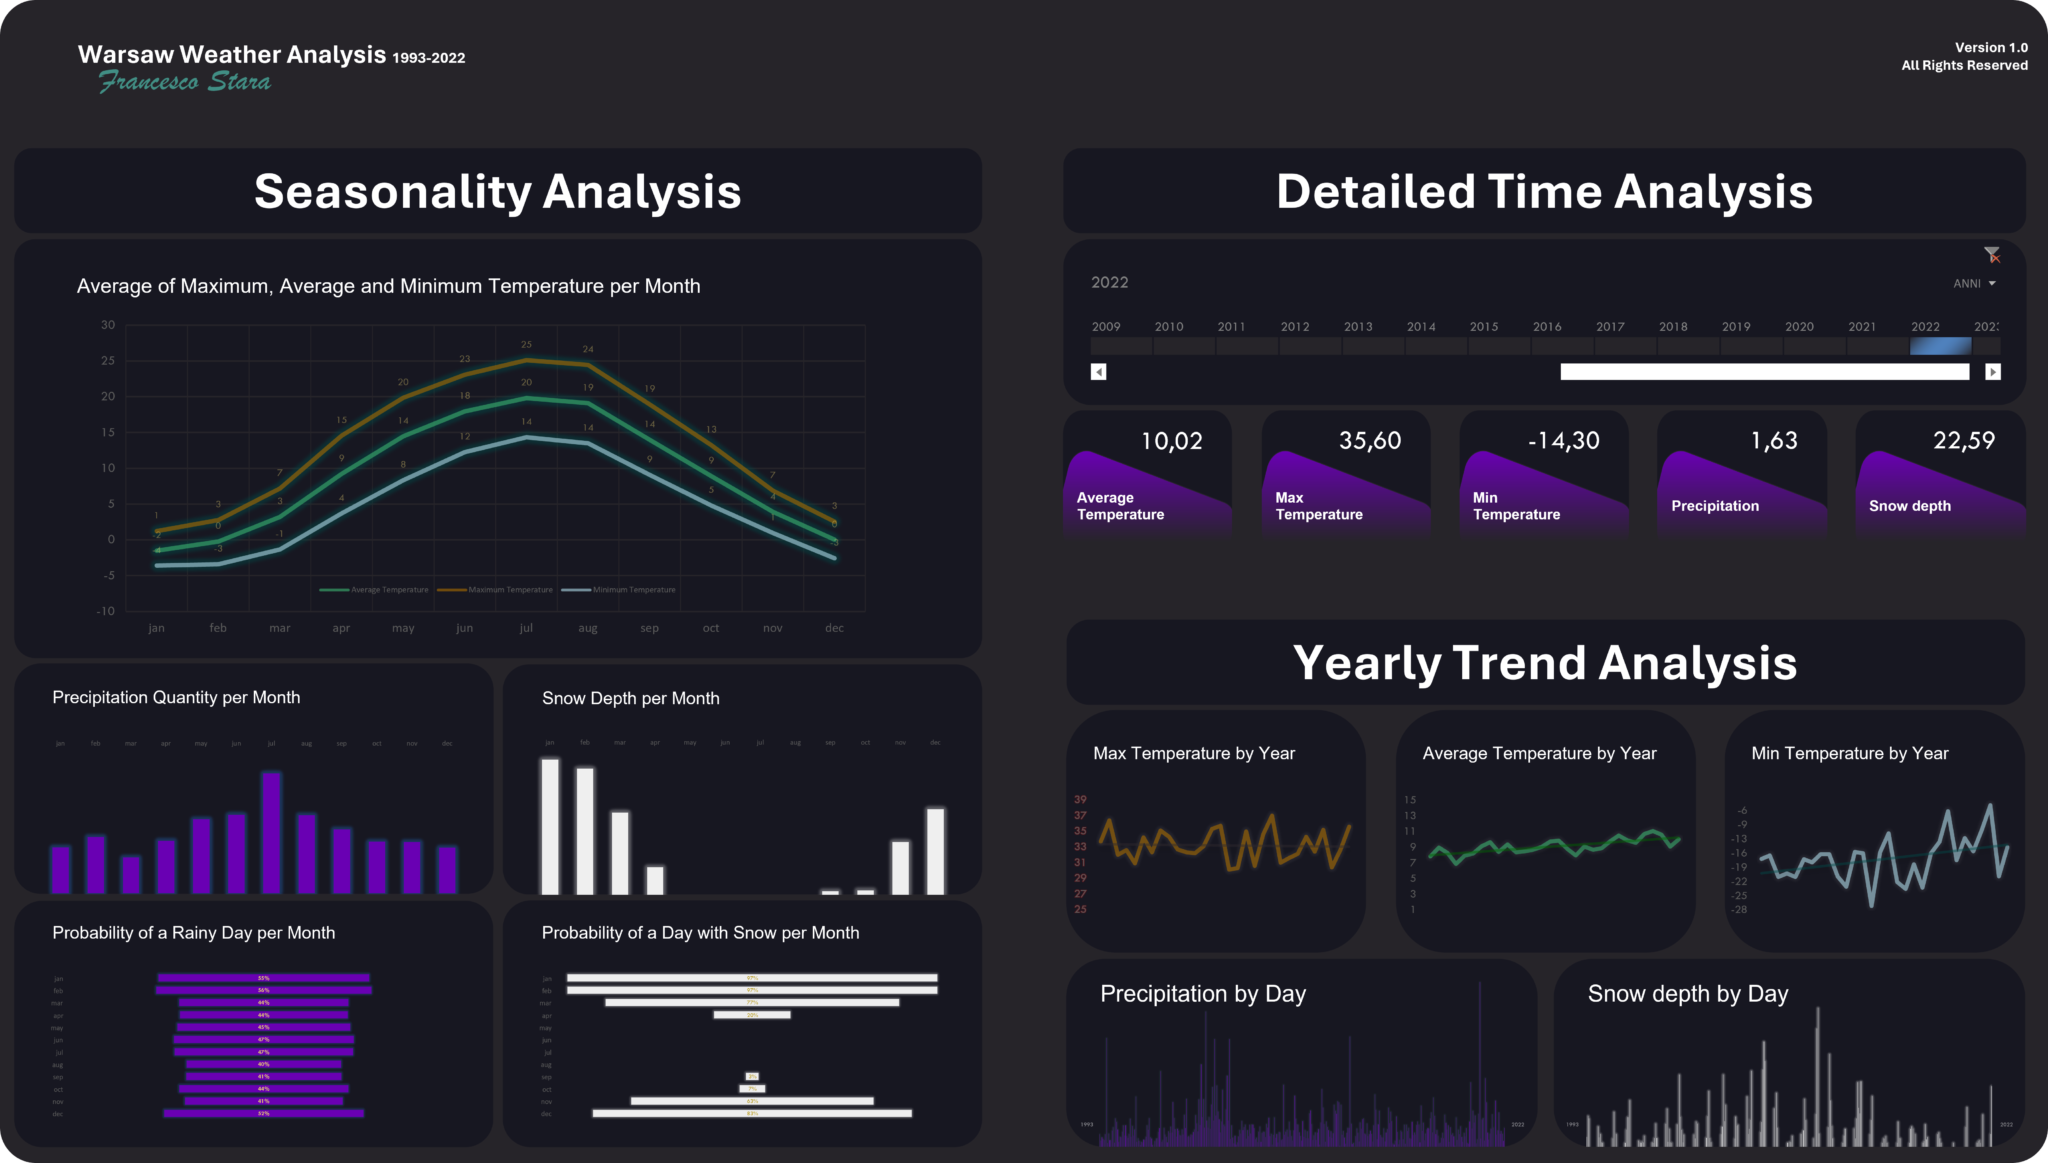
In this weather data analysis project, I analysed daily meteorological data from Warsaw, Poland from 1993 to 2022. I used Python for initial…

Data Analysis and Business Intelligence (BI) are field that are always in evolution, so what’s the best way to you stand out? The…
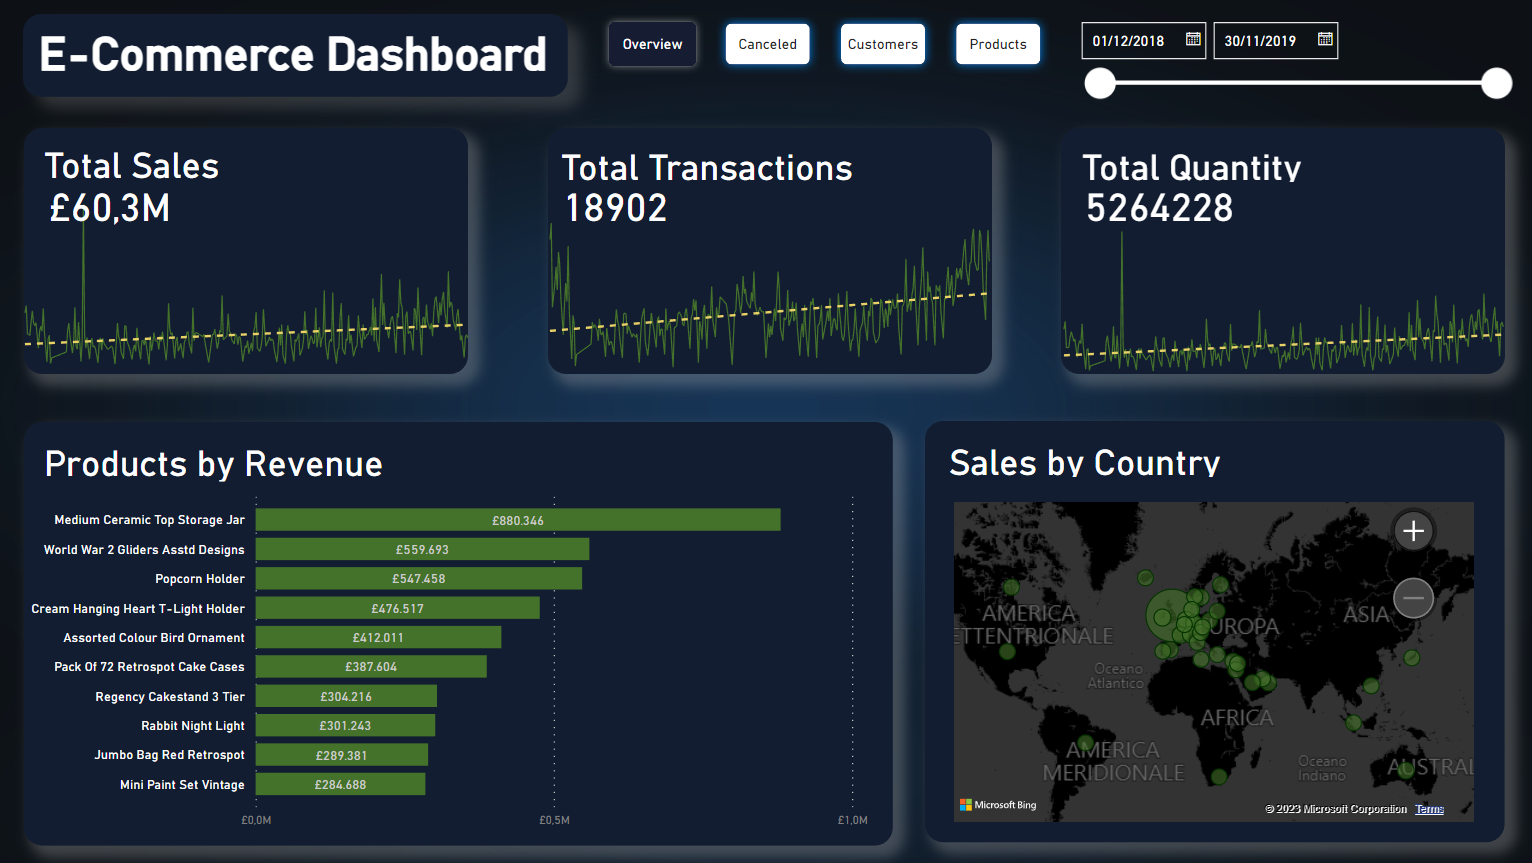
In this project, I worked on a comprehensive examination of online transactional data, of an e-commerce. I utilized Python for preliminary exploration, SQL…

In this article I will show you how to create a personalized dataset for your personal project or case study. It will have…

This project presents an exploratory data analysis (EDA) and an interactive dashboard idea centered around a unique dataset from five different vending machines…

In this guide I will show the best way to find datasets for your projects to showcase your skills and include in your…

In this project with healthcare data, I will explore deeply into the health of Pima Indian women.
Using Python, I first cleaned and explored the data. After, I used statistical methods and data visualization techniques to reveal hidden patterns, correlations, and insights within the data. This analysis cleared the path for predictive modeling. So, with machine learning, I took on the role of a predictor, trying to forecast possible diabetes diagnoses.